Mean Shift Segmentation
Mean Shift algorithm is the first image analysis research I did in my graduate study in 2015. It is usually used as image segmentation or tracking algorithm. This blog will start with the principle of mean shift and its image segmentation application.
Non-Parametic Density Estimation
This will give you the basic statics background and I won’t talk too much about this.
If we have 6 data points -2.1, -1.3, -0.4, 1.9, 5.1, 6.2. Let’s draw the histogram. Set width of each bin as 2 and we can get following histogram (left one) (from wiki).

That’s it, the basic non-parametic density estimation. From this histogram we can know the distribution probability of the points. However, it has some disadvantages. 1. It is not smooth. 2.It highly depends on the width of the bin and the start point. The calculation function for histogram is pretty simply. How can we change the function and make the histogram more smooth and stable? We should calculate the probability density of every point (right one).

For 2D case here, how can we get the histogram of the red points? We should choose a circle instead of rectangle.
Change the shape of the “bins” to a circle. We can simply count the number of the red points inside the circle and divided by the total number to get the density distribution . If the circle is small enough, we can get . For high dimensional situation, the principle should be same. The histogram is the density estimation and the counting function is called kernel function.
Mean Shift Clustering
The kernel function we choose is the uniform kernel. (We can choose other function of course.)
So we can get total number of K inside 0 to 1 for example, . For more general density function, that is ( is the general width instead of 0 to 1)
And we have the density function . For high dimension,
For any point, the density we can write as
Now we have density function, so we can easily get the gradient function.
We can think about this gradient function in this way. Every point will have a force dragging the point and the the power of the force is . This force is combined from the forces that every other point give to the point .We can use this function to find the new position. The is also a kernel function stands for the density at point . If we use uniform kernel, the density is the same with density. So, we can derive the density function as
The third part of the function is the shift value, actually I think it is the shift direction, . So based on shift value, we have a new position for this point. Next what we need to do is to calculated shift value again based on new point until it will not move any more, which is called mode point. This is what we called adaptive step.
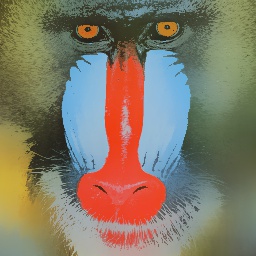
Mean Shift Filtering
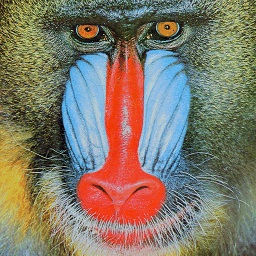
Mean clustering is to find the mode point. Every point need to find its mode point. For the feature space, every point will be considered as 5 dimensional point . There will be 2 bandwidth for this 5D point, one in coordinator, one in RGB color space. We should separate these 2 bandwidth when calculate.
For image filtering, we should set a maximum iteration number as 5 to find mode point. Based on and uniform kernel, it is easy to filter the point. Accumulate all point inside the bandwidth and divided by the totally number.
Next step is to find which points are within the bandwidth. For easy computation, the coordinator feature space will be considered as rectangle for easy calculation. So the points will be calculated inside rectangle. This will satisfy the coordinator bandwidth. Next is in the color feature space. Color distance will be the criterion.
The color distance should be less than color bandwidth. So now all points satisfy the two bandwidth are obtained. The final step is to use the formula above to get the next shift point. Remember the point is 5D point. 5 iteration or the point will not be changed in coordinator or in color space, that point is the mode point we want. And for easy calculation, we only give the color to the original point.
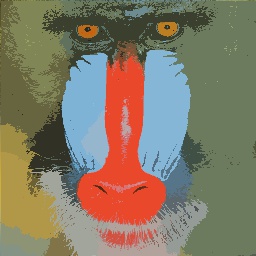
Mean Shift Segmentation and Regions Merge
Flood fill algorithm and merge the small region.
Summary
Source Code : My Github
Mean Shift Segmentation should have three steps:
- Filtering (Mode Searching)
- Merge Similar Regions (Mode clustering)
- Merge Small Regions
In the original paper, for step 2, when considered mode clustering, not only color similarity and also coordinate position should be within the bandwidth correspondingly. Here, we will only consider color factor to do segmentation.
Filtering process is the main part of the algorithm.
- Determined the Uniform kernel for filtering.
- Based on one point1, within the space bandwidth, calculate every point color distance to the center point.
- For all points, which color distance is within the color bandwidth, calculate the shift vector
for the center point and add together2. - Shift the center point. center = center + shift (include color).
- Repeat above steps and stop after 5 iterations or the center point doesn’t move.
- Assigned color to the original point the color. This original point belong to this cluster.
1.Every point will be considered as 5-D point(R, G, B, x, y).
2.Shift value is the average value of all points within the bandwidth.
This code includes two functions.
- Filtering
- Segmentation
Segmentation function is the Mean Shift Segmentation first two process, which has two parts, one is Mean Shift filtering and other one is flood filled algorithm (Region Growing).